Sub-Nyquist Imaging
(This research was updated. To see the updated version, please read the article directly)
https://arxiv.org/abs/2012.07250
OLD VERSION (below):
Computational Ghost Imaging has long been used as a single point imaging technique. According to my former two projects, pink noise pattern substitutes white noise pattern in this scheme because it has significant advantages on Noise-free Imaging, Moving Object Imaging, and imaging only with limited number of sampling. However, the weakness is that if we increase the sampling number, the quality of results do not improve a lot compared to the white noise pattern. Here I find an Orthonormalization approach based on pink noise patterns to overcome this disadvantage via continuously enhancing signal-to-noise ratio. In particular, it still maintains pink noise’s advantages, and even owns blue noise’s ability to sharpen the edge of the image if we reverse the order of sampling patterns.
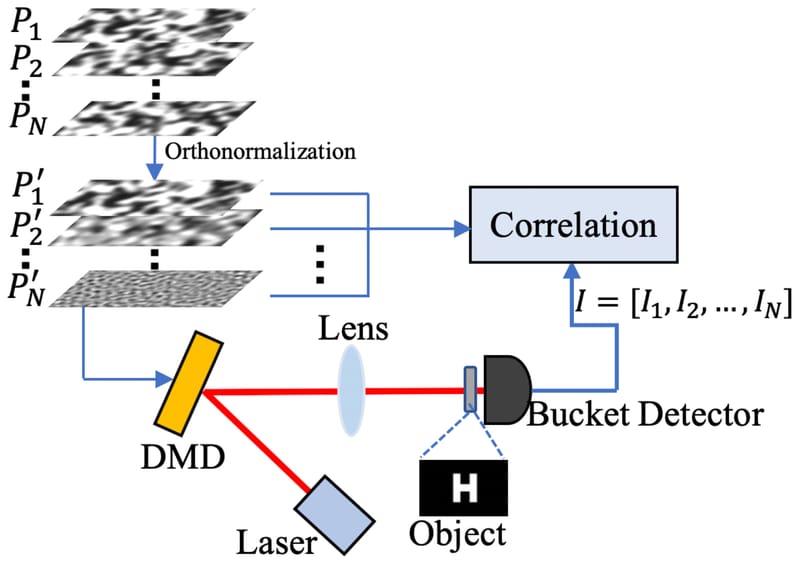
The setup and features of orthonormalized red noise patterns are shown in Fig. 1.
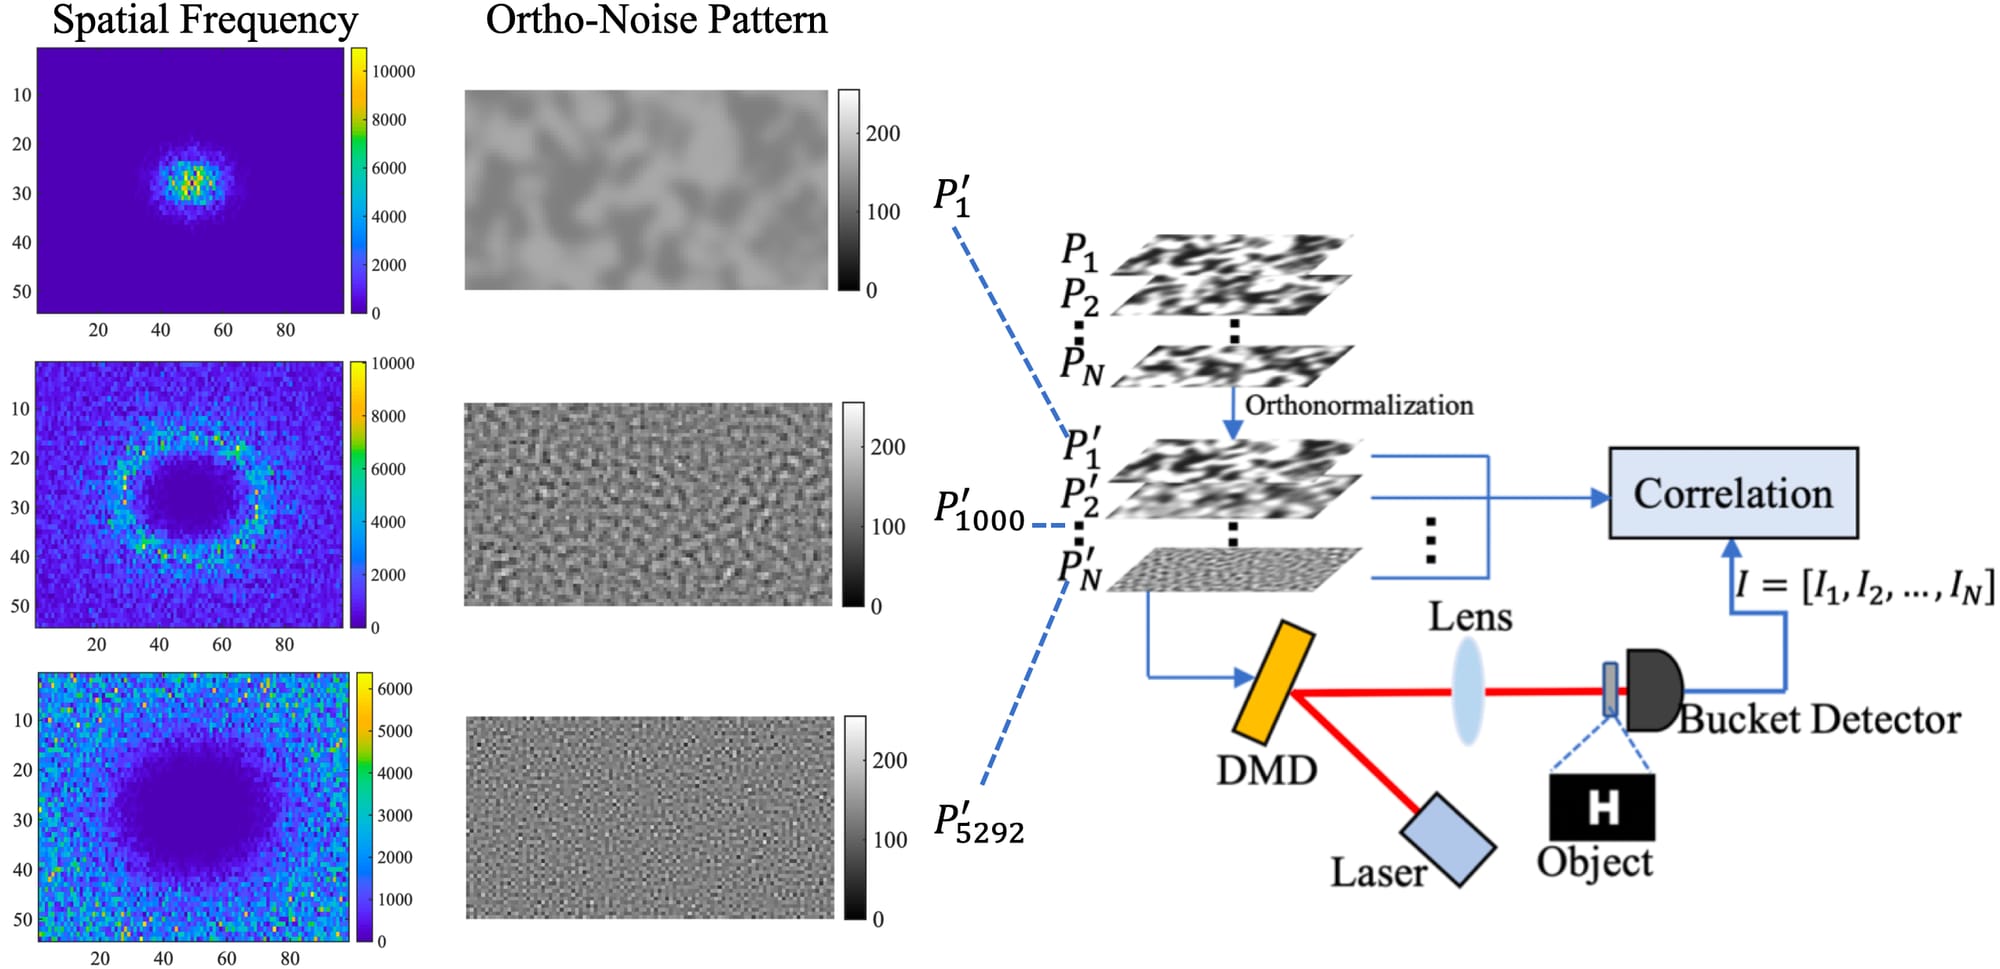
Fig. 1. Schematic of the setup for orthonormal CGI, several ortho-noise patterns, and their spatial frequency after Fourier transformation.
The orthonormalization is performed according to Gram-Schmidt process. Besides, the pink and white noise patterns are generated as same as the Noise-free and Moving Object experiments. In Fig. 1, It is quite obvious to find out that the peak of frequency is moving to the outer-space, which means the patterns are gradually owning blue noise’s feature with the progressive orthonormalization process. From here we know that the reason why Pink Noise Orthonormal Ghost Imaging (POGI) maintains the pink noise’s advantage while the sampling number is small, and why POGI can continuously enhance the resolution when we increase the number of sampling. Indeed, the POGI owns the White Noise Orthonormal Ghost Imaging (WOGI) feature when the sampling number close to the total pixel in one pattern (here it is 54 x 98). Moreover, if we reverse the order of noise patterns, we would get the blue noise featured CGI first when the sampling number is small, and finally the result returns to the WOGI again. These features will be shown in the simulation and experimental results. To make sure, we do correlation as well both from odered and reversed pattern sequence. Fig. 2. is the results of cross-correlation and auto-correlation ratio via applying different number of patterns.
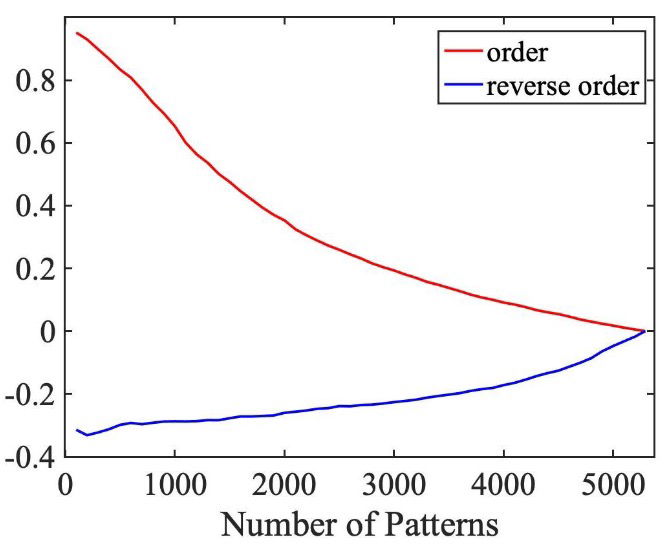
Fig. 2. Cross-auto correlation ratio.
From the red line we can see that the ratio is gradually dwindling, thus paving the way from pink noise feature toward white noise feature. On the other hand, the blue line indicates that the negative cross-correlation feature belonging to blue noise turns to disappear when we increase the number of patterns.
To test the feasibility of the POGI method, we run a simulation in positive order in ideal condition without environmental and system noise. To better judge the performance of various methods rather than intuitive assessments, we utilize four evaluating indicators of image quality: the Contrast-to-Noise Ratio(CNR), the Mean Square Error (MSE), the Peak Signal-to-Noise Ratio (PSNR), and the Correlation Coefficient (CC). We compare the POGI to White Noise (WGI), WOGI, and Pink Noise (PGI). For POGI, we orthonormalize Gaussian Pink Noise (GPOGI) and Rayleigh Pink Noise (UPOGI). The simulation results are shown in Fig. 3.
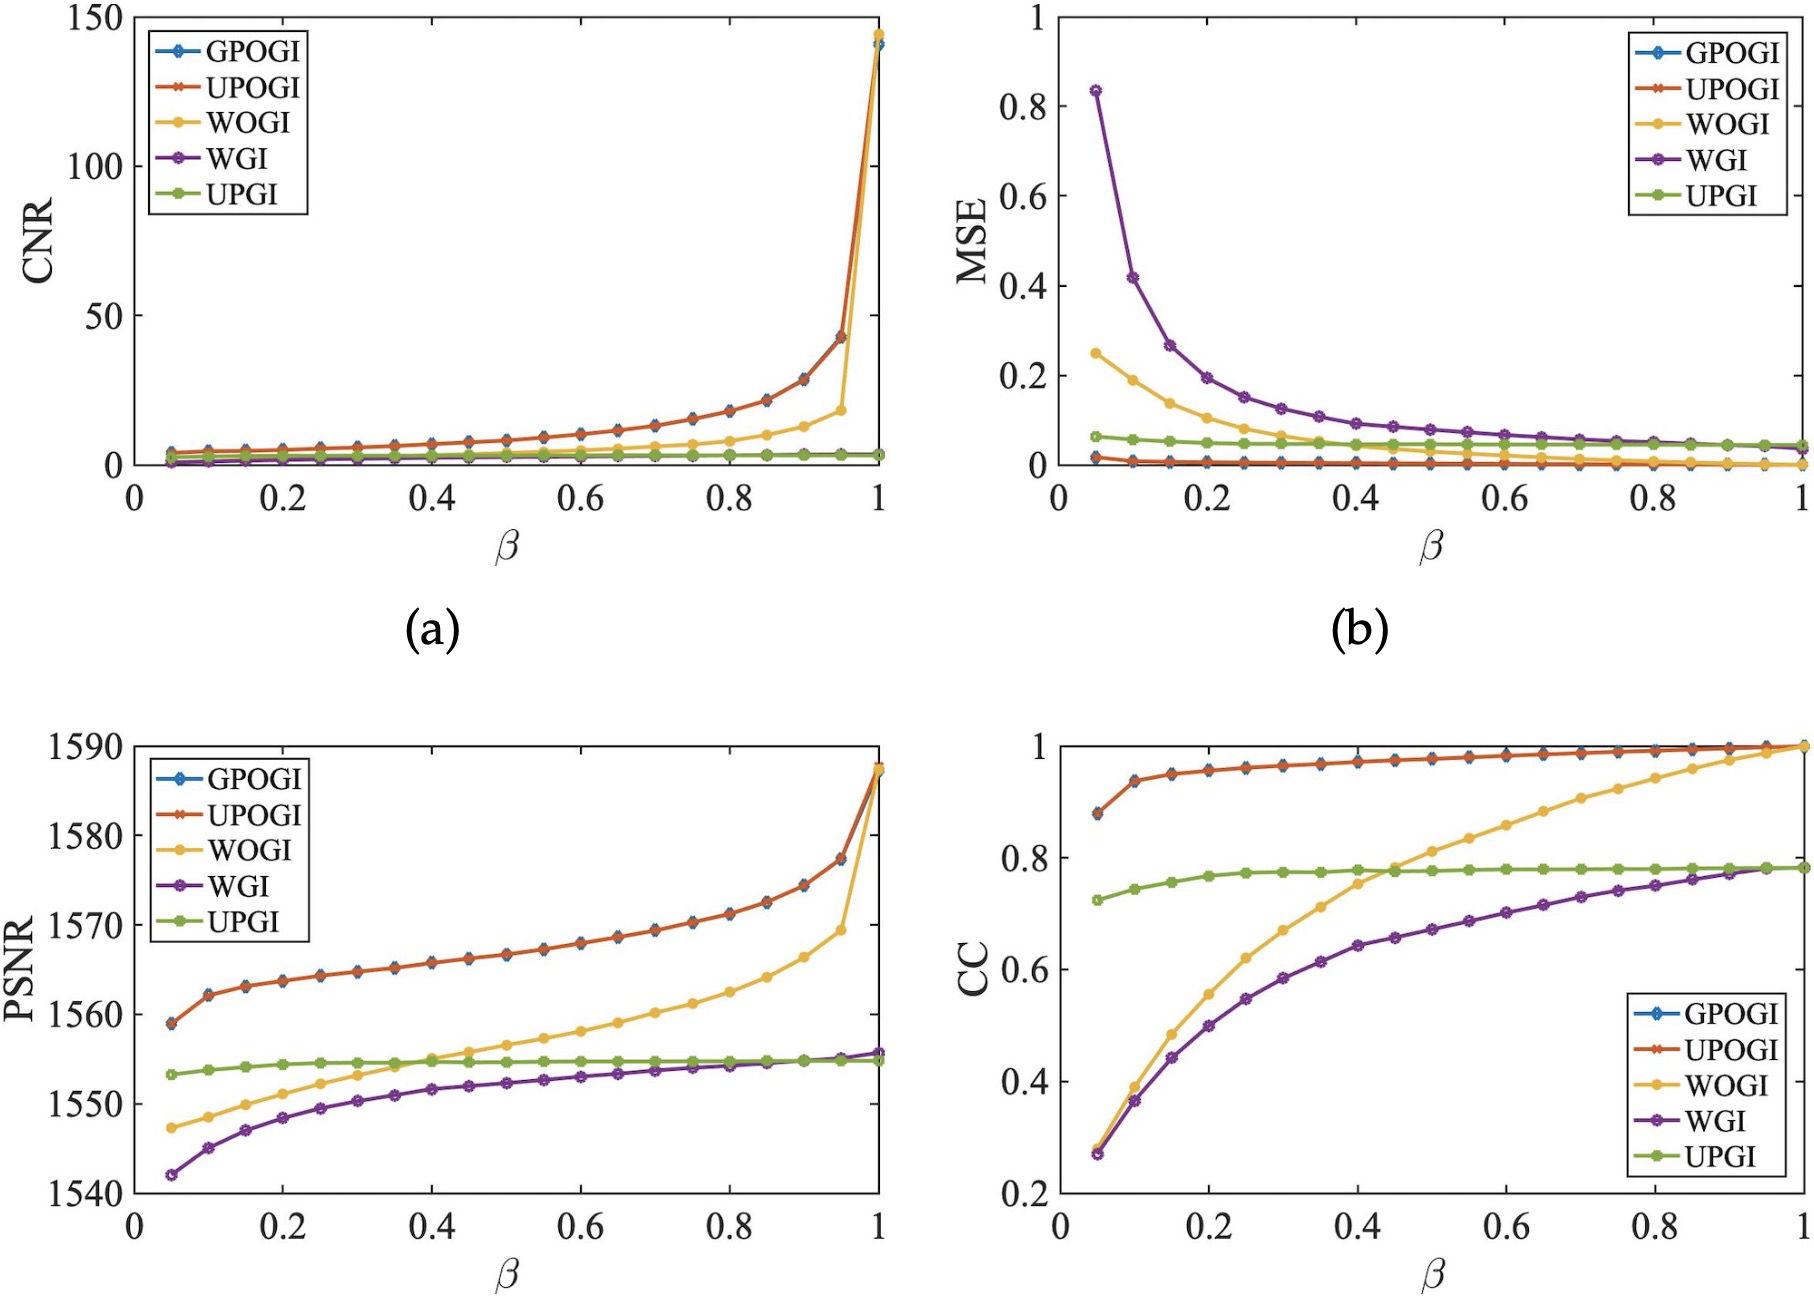
Fig. 3. Image qualities via different measurement times by CGI in ideal condition. (a) is lines of CNR, (b) is MSE, (c) is PSNR, (d) is CC.
β = Npattern / Npixel. And a simulation with noise which is about ±1 % signal is shown in Fig. 4.
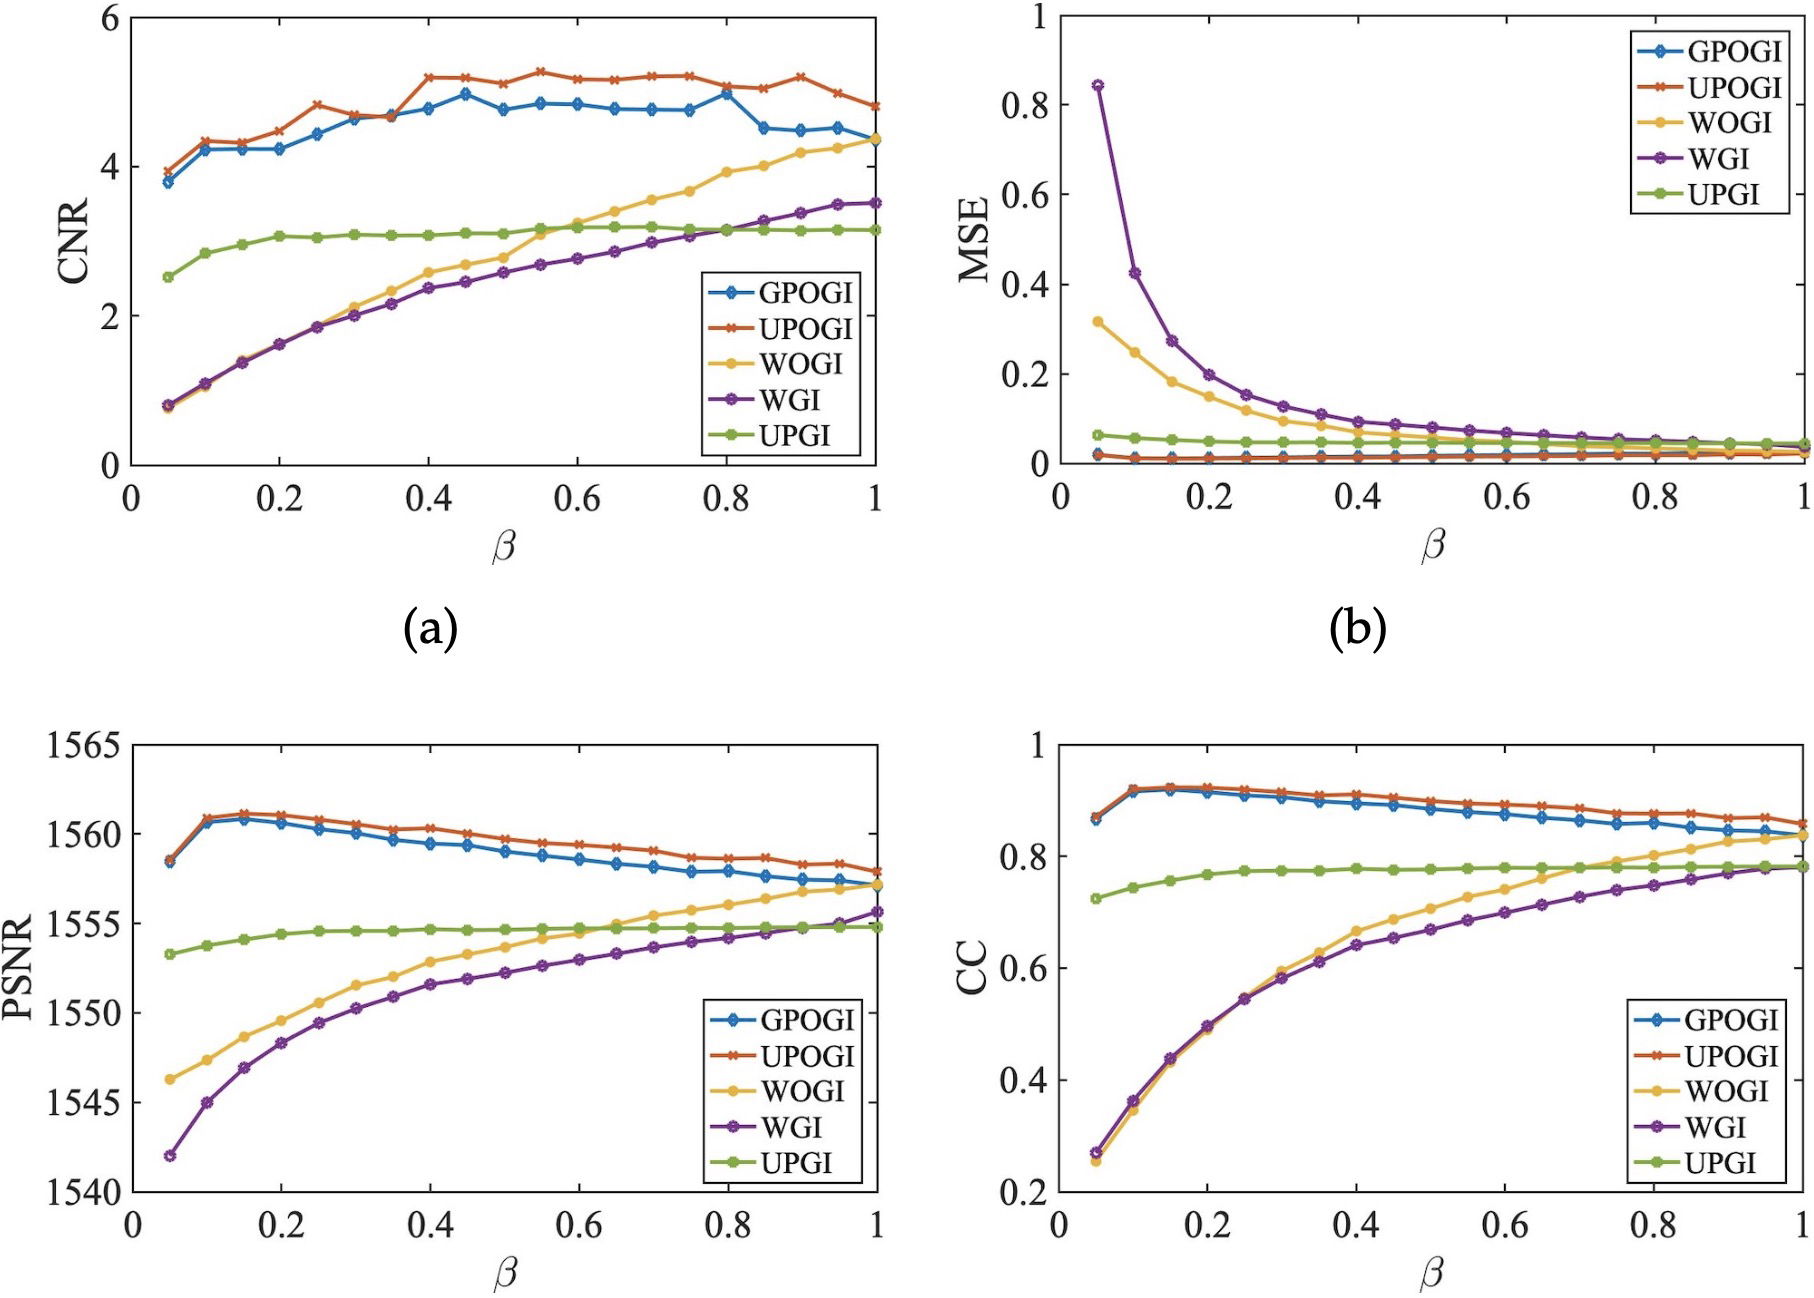
Fig. 4. Image qualities via different measurement times by CGI with noise at ±1 % signal level. (a) is lines of CNR, (b) is MSE, (c) is PSNR, (d) is CC.
The orthonormalized results are always better than results generated from normal patterns. Nevertheless, these peaks give us an indication that, under the real experimental condition, this POGI method would have an optimum sampling number, and at this point the image quality is the best.
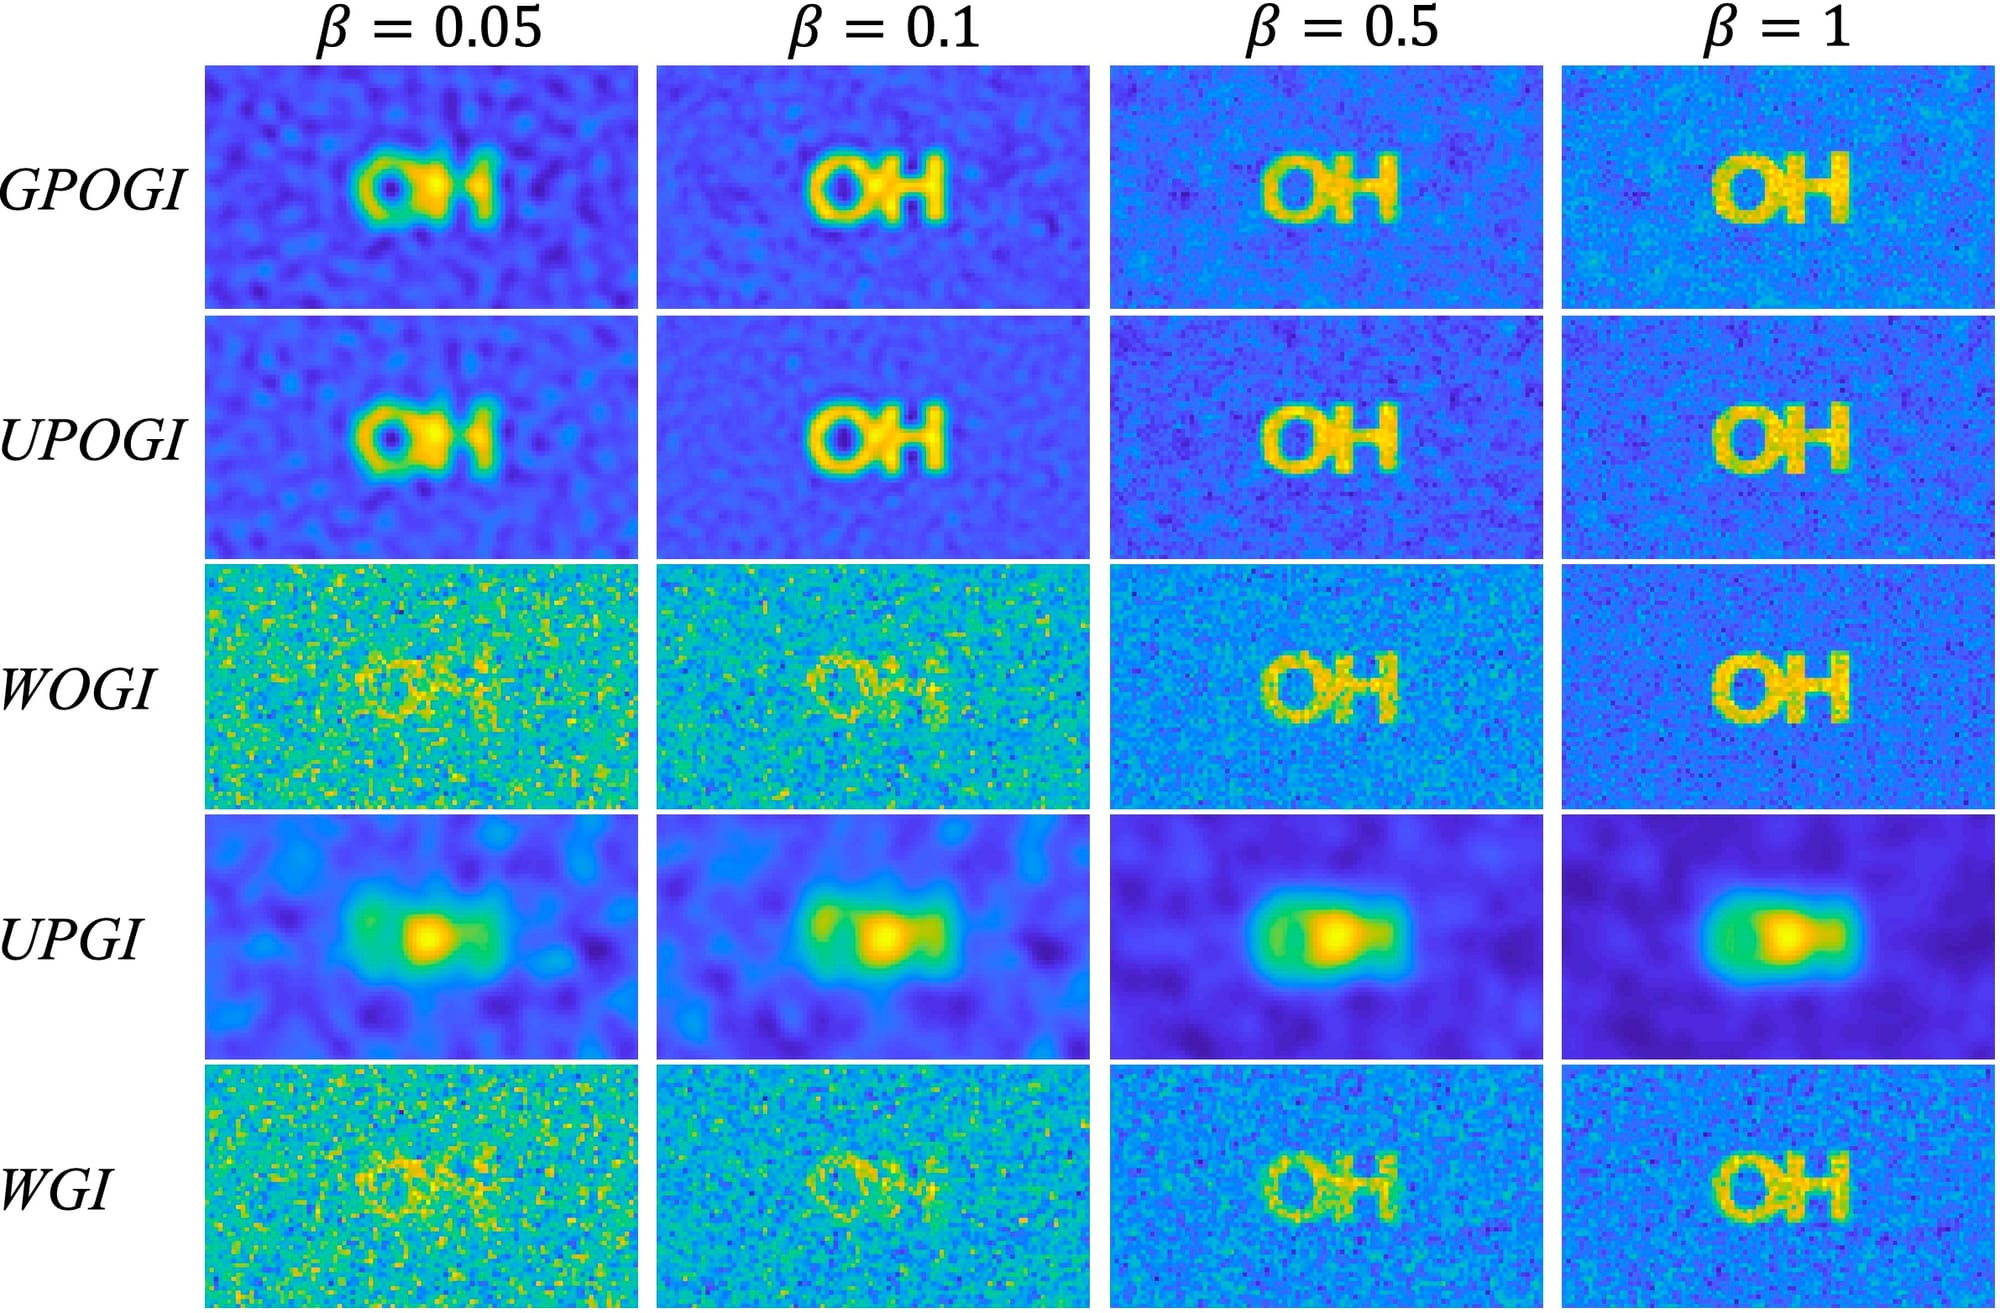
Fig. 5. CGI images with various β.
The experimental results is shown in Fig. 5. Then, we calculate their evaluating indicator, Fig. 6. We could find out that even though the quality of images retrieved from UPOGI and GPOGI are the best when β = 0.1 if judged by evaluating indicator, the results when β = 1 seem to have stronger visibility. It is because they have sharper edge compared to results when β = 0.1. The reason is while β = 1 the cross-correlation disappears, thus no contribution to the area where the object does not allow the light to pass through. We can conclude that when β = 0.1 the results have substantially strong SNR, while, when β = 1 the results restore the image authentically.
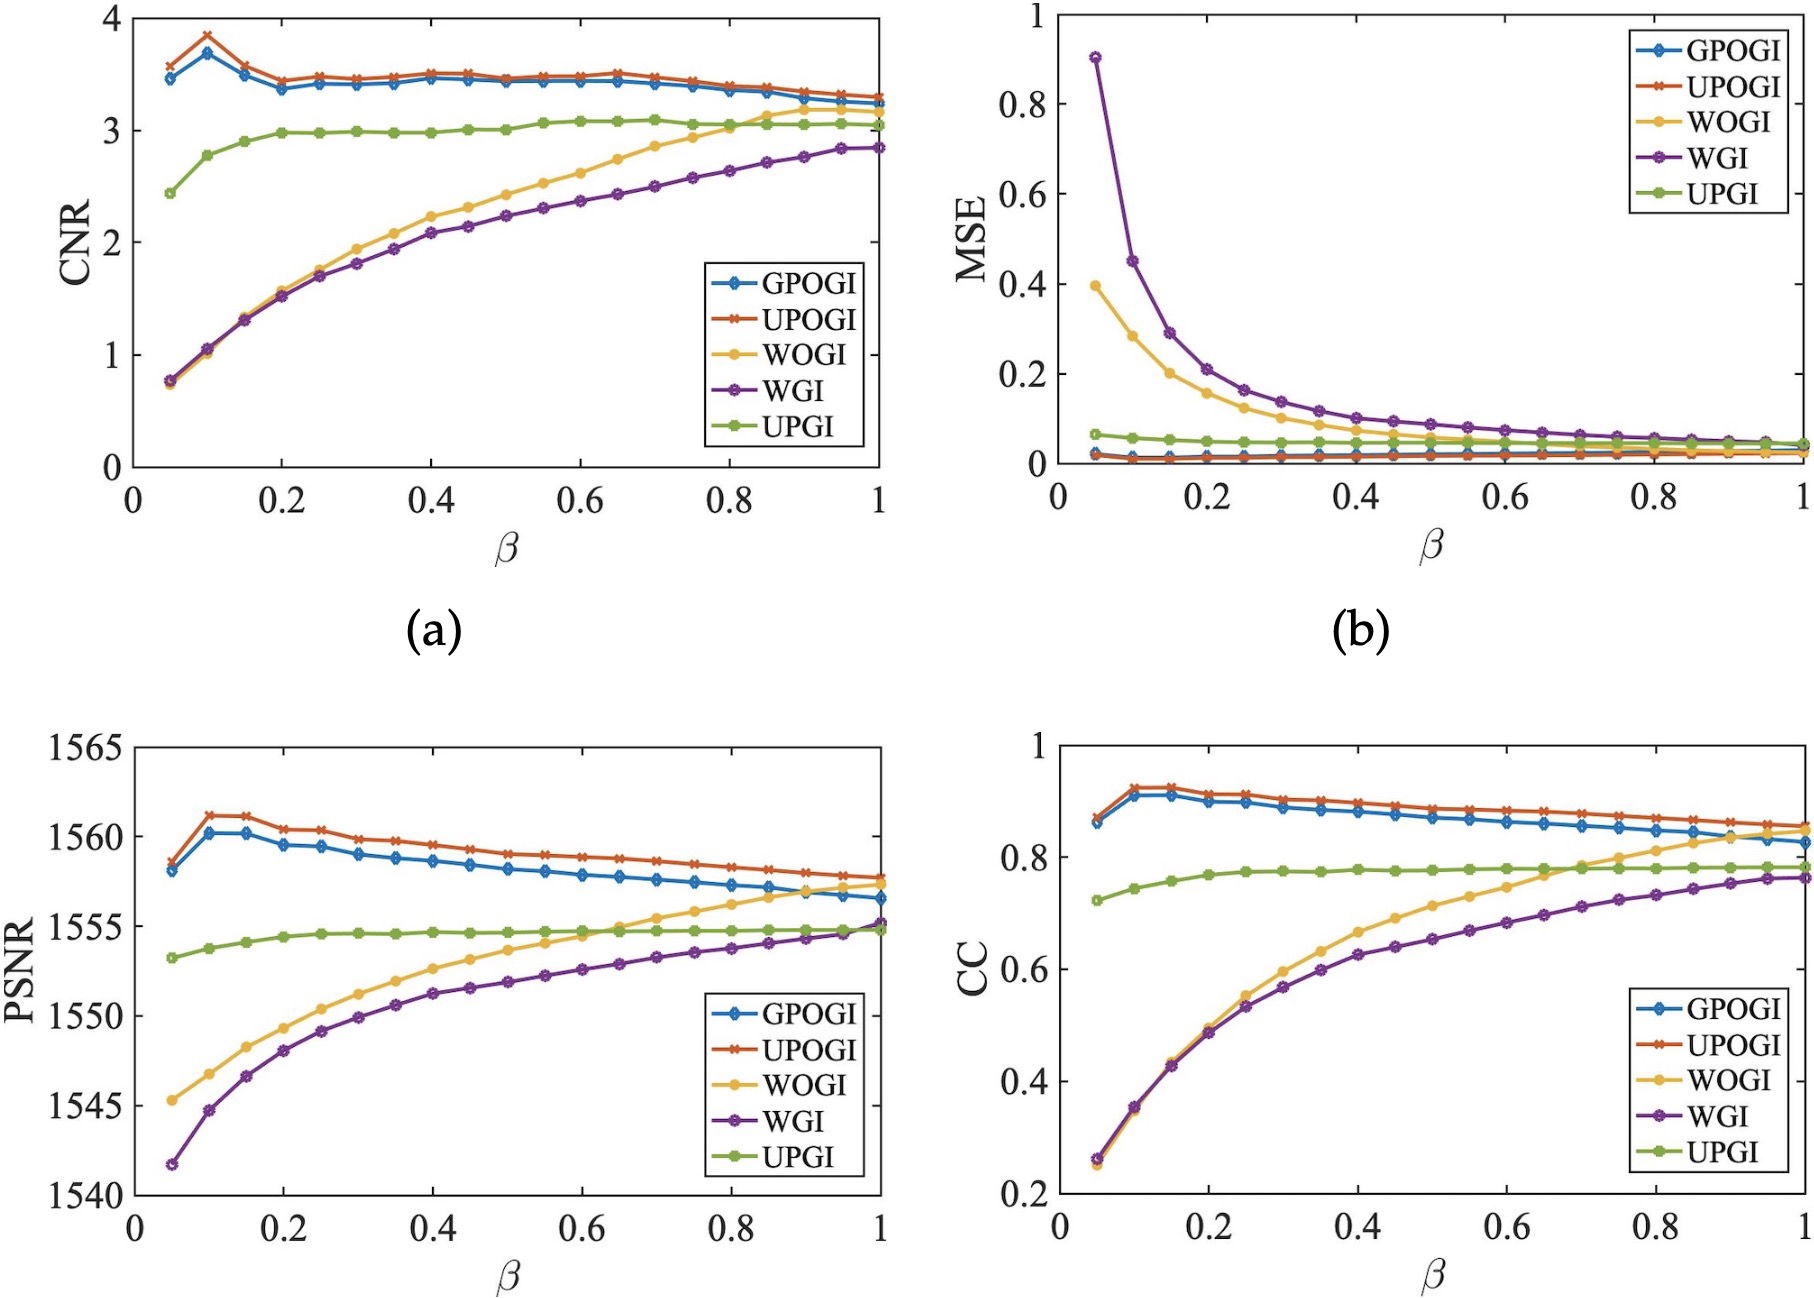
Fig. 6. Image qualities via different measurement times by CGI in the experiment. (a) is lines of CNR, (b) is MSE, (c) is PSNR, (d) is CC.
Moreover, we present some results when we inverse the order of measurement or just inverse the collected data in Fig. 7. Here we notice that this negative cross-correlation feature can sharpen the edge of figures.
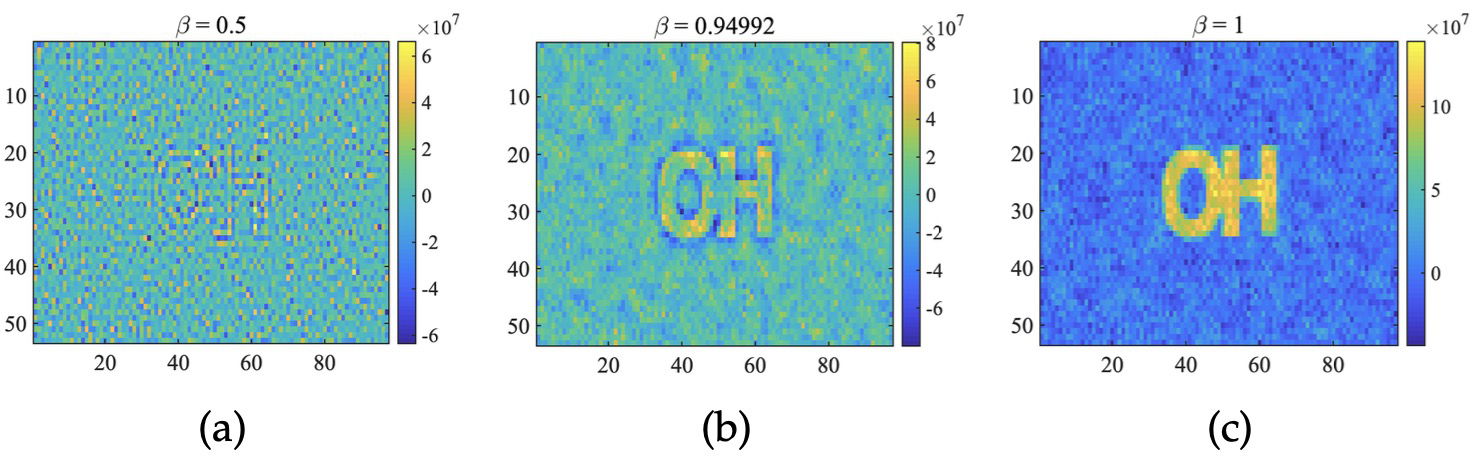
Fig. 7. Reversed pattern measurement. (a)-(c) are results with various sampling number.